This example shows how to use JavaScript and C++ intertwined. This way it is possible to implement core functionality of the widgets in C++ and use JavaScript to write higher level application logic. One reason for mixing C++ and JavaScript instead of using only JavaScript is that JavaScript can introduce performance overhead to the application.
We create a widget for plotting 2D graphs with C++ and then create a plugin of that. The data to be plotted is downloaded as a CSV file. The initialization and downloading of the data is done using JavaScript. This example uses request-module of node.js. Before running the example it has to be installed by running: npm install request
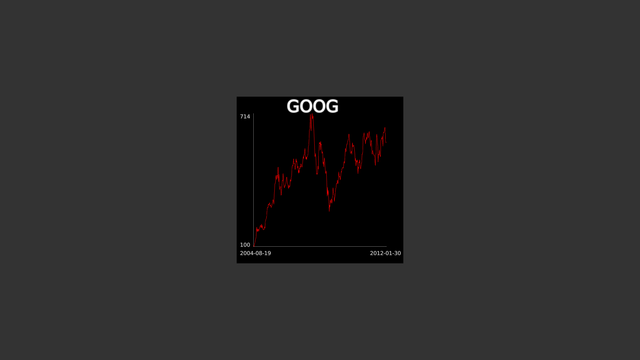
Screenshot of MixedJavaScriptExample
First, let's take a look of Graph2DWidget which handles the rendering. Graph2DWidget is inherited from MultiWidgets::Widget to be able to implement custom rendering. The data for the plot is passed as an event to the object. For this MultiWidgets::Widget::eventProcess must also be overriden. Note that all of the functionality of Graph2DWidget could be implemented with JavaScript using MultiWidgets::JavaScriptWidget as well. The full listing of member functions is shown below:
{
public:
Graph2DWidget();
virtual ~Graph2DWidget();
void updateLabels();
protected:
The class has values to be plotted and some attributes concerning the details of plotting as its private members:
private:
std::vector<float> m_values;
std::vector<QString> m_labels;
The constructor of the class initializes the attributes of the object, sets the correct CSS-type and registers handling of values event. After this text widgets for the annotation of the plot are created.
Graph2DWidget::Graph2DWidget()
: m_graphColor(this, "graph-color", Radiant::Color(1, 0, 0, 1)),
m_textColor(this, "text-color", Radiant::Color(1, 1, 1, 1)),
m_headerText(this, "header-text"),
m_minValue(this, "min-value"),
m_maxValue(this, "max-value")
{
setCSSType("Graph2DWidget");
eventAddIn("values");
QString widgetIds[] = {"minx", "maxx", "miny", "maxy", "title"};
for(size_t i = 0; i < 5; ++i) {
auto text = MultiWidgets::create<MultiWidgets::TextWidget>();
text->setCSSId(widgetIds[i]);
addChild(text);
}
}
In eventProcess the data is read to the internal structures of the object. Also the minimum and maximum values for the plotting are resolved from the sent data. Maximum and minimum values can be specified explicitly by putting them after the data or implicitly by leaving them out. In this example these values are picked from the data.
{
if(id == "values") {
m_values.clear();
m_labels.clear();
float max = 0, min = 0;
for(int i = 0; i < length; ++i) {
if(i == 0) max = min = m_values.back();
m_labels.push_back(QString());
}
if(length > 0) updateLabels();
} else {
Widget::eventProcess(id, data);
}
}
Every time the data is specified, the labels of the plot are updated in updateLabels function. The function just loops over the children of the widget and sets the appropriate texts for the widgets based on their CSS ids. Alternatively we could have just stored the text widgets as MultiWidgets::TextWidgetPtr member variables in the constructor, or we could use MultiWidgets::Widget::find to search with a CSS selector: find<MultiWidgets::TextWidget>("#minx");
void Graph2DWidget::updateLabels() {
for(size_t i = 0; i < numChildren(); ++i) {
if(!text) continue;
if(text->cssId() == "minx")
else if(text->cssId() == "maxx")
text->setText(m_labels.back());
else if(text->cssId() == "miny")
text->setText(QString::number(m_minValue));
else if(text->cssId() == "maxy")
text->setText(QString::number(m_maxValue));
}
}
The plotting of the graph is quite straightforward. It is implemented by overriding MultiWidgets::Widget::renderContent function. First the frames of the plot are drawn.
{
};
r.
drawLine(linepoints[0], linepoints[1], style);
r.
drawLine(linepoints[1], linepoints[2], style);
After this polyline of the graph is drawn. First we calculate the transformed points of the polyline and store them in a separate container. After this the command for drawing the polyline is executed.
std::vector<Nimble::Vector2f> polyline;
float scale = m_maxValue - m_minValue;
for(size_t i = 0; i < m_values.size(); ++i) {
float x =
Nimble::Math::lerp(linepoints[0].x, linepoints[2].x, static_cast<float>(i)/m_values.size());
}
}
Finally the following line is added to the end of Graph2DWidget.cpp for being able to use this widget from JavaScript.
WIDGET_PLUGIN(Graph2DWidget, "Cornerstone.Examples.Graph2DWidget", "Graph2DWidget");
The "main function" is located in JavaScript-file. It sets CSS file for the application and creates the object for plotting using the plugin factory. Finally the CSV file for plotter is loaded. When it is received the function given as an argument is called.
if ($.app.styleFilenames().length == '') {
$.app.addStyleFilename(__PATH__ + "/style.css");
}
var plotter = MultiWidgets.createPlugin("Cornerstone.Examples.Graph2DWidget");
if(plotter == null) {
Radiant.info("Could not find example-plugin. Note that ScriptRunner does not support debug builds of plugins on Windows.");
} else {
plotter.setCSSId("plotter");
$.app.mainLayer().addChild(plotter);
getCSV(function(data) {
plotter.eventProcess("values", data);
});
}
Downloading of CSV uses request-module. When the downloaded file is received it is put into the Radiant::BinaryData-object. After this the supported callback-function is called. In this case it just calls eventProcess of our Graph2DWidget-object.
function getCSV(callback) {
var today = new Date();
var url = "http://cornerstone.multitouch.fi/sdk-examples/goog.csv";
require(
"request").get(url,
function(
error, response, body) {
var lst = [];
body.split("\n").forEach(function(line, index) {
var splitted = line.split(",");
var len = splitted.length;
if(index != 0 && len >= 2)
lst.push([splitted[0], parseInt(splitted[len-1])]);
});
data.writeInt32(lst.length);
for(var i = lst.length - 1; i >= 0; --i) {
data.writeInt32(lst[i][1]);
data.writeString(lst[i][0]);
}
callback(data);
});
}
Full JavaScript-source is shown below.
function getCSV(callback) {
var today = new Date();
var url = "http://cornerstone.multitouch.fi/sdk-examples/goog.csv";
require(
"request").get(url,
function(
error, response, body) {
var lst = [];
body.split("\n").forEach(function(line, index) {
var splitted = line.split(",");
var len = splitted.length;
if(index != 0 && len >= 2)
lst.push([splitted[0], parseInt(splitted[len-1])]);
});
data.writeInt32(lst.length);
for(var i = lst.length - 1; i >= 0; --i) {
data.writeInt32(lst[i][1]);
data.writeString(lst[i][0]);
}
callback(data);
});
}
if ($.app.styleFilenames().length == '') {
$.app.addStyleFilename(__PATH__ + "/style.css");
}
var plotter = MultiWidgets.createPlugin("Cornerstone.Examples.Graph2DWidget");
if(plotter == null) {
Radiant.info("Could not find example-plugin. Note that ScriptRunner does not support debug builds of plugins on Windows.");
} else {
plotter.setCSSId("plotter");
$.app.mainLayer().addChild(plotter);
getCSV(function(data) {
plotter.eventProcess("values", data);
});
}

